Odds of Selling

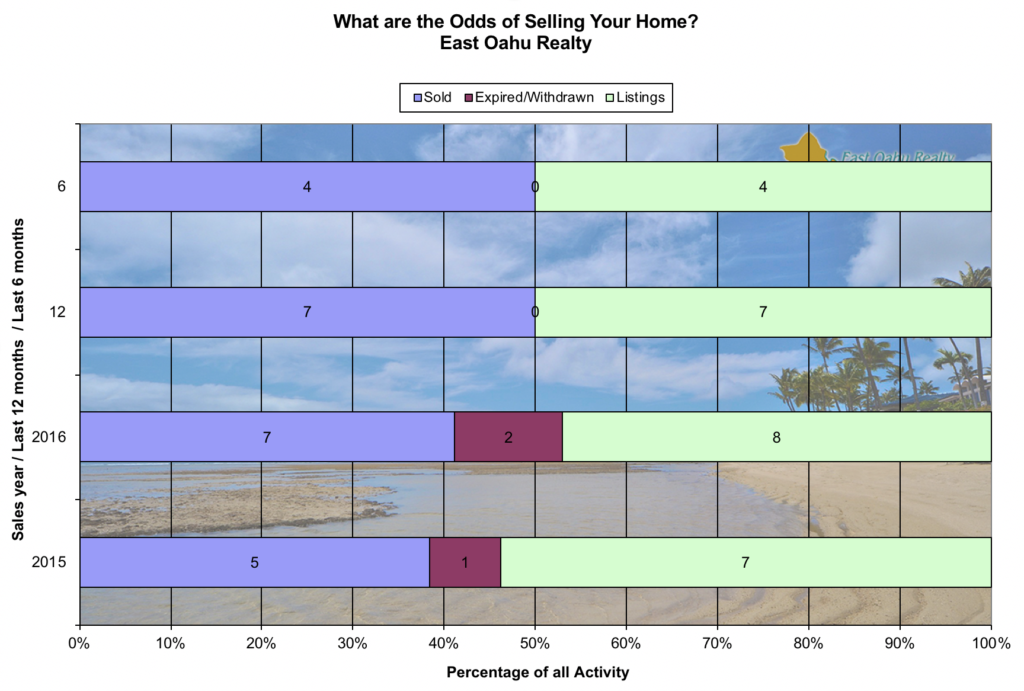
In 2015, 7units came on to the market (green), 1 was withdrawn (red) and 5 were sold (purple).  71% absorption rate in Koko Villa

In 2016, 8 units came on to the market (green), 2 were withdrawn (red) and 7 were sold (purple)… 88% sold

In the past 12 months, 7 units came on the market (G), 0 were withdrawn (R)* and 7 were sold (P).  100% sold

In the past 6 months, 4 units came on the market (G), 0 were withdrawn (R) and 4 were sold (P).  Also, 100% sold

This chart shows us the average of the last three years of asking prices, relative to selling prices

On average, over the past 3 years, it has taken about 74 days to get an accepted contract.

Seasonal Buying Patterns

If we look at the Seasonal Buying Patterns chart, we see that most closings, in the past three years, have occurred in February (3).  There are also very consistent closings fro Sept thru May (2 each month).  This would suggest a very consistence and even distribution.  With the exception of summer months, where there were 2 closings total that occurred.  If we assume that most properties take on average, 45 to 60 days to close,  this would suggest that April and May are poor months to list a home in Koko Villa.  *If there is low supply anytime is good.

This chart plots every closing, from the past 3 years, based on interior square footage and sales price.

In the past 2 years, we see an average of .6 new properties/month coming on the market (top left).  The properties enter the pond (or market) and then “flow’ across the pond.   On average, .6 of these properties have excited the pond (to the right) each month. With a total inventory of 2 units, this gives us a monthly supply of 3.4 months for these properties to sell. Therefore, each month a seller has an 29.2% chance of selling.

Close Menu